Display of waveform and all leads or channels

The waveviewer shows all leads (channels) in the same order as stored in the DICOM waveform file. If the leads do not fit inside the window, you can resize the window of use the leads-scrollbar to scroll through all available leads. The leads-scrollbar is shown on the left side, the labels of each lead are shown inside the drawing space, left side.
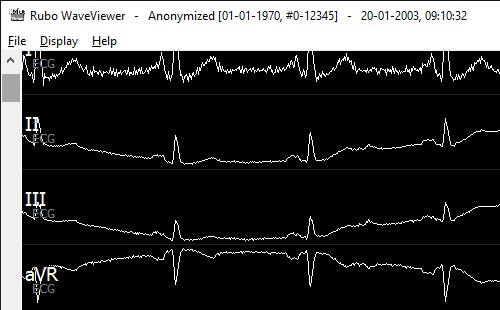
Leads scrollbar and labels of each channel
The waveform display time is shown inside the drawing space, at the top. The time is displayed where the waveform is drawn, that means with paper roll display, it's shown top right, with scrolling display mode it's drawn when the leads are drawn. See 'Setup' to change the display mode.
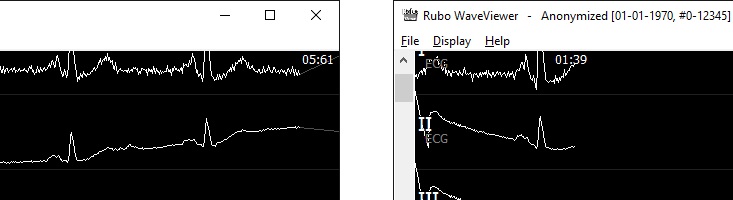
Time display in paper-roll display (left) and scrolling-display (right)
The time scale of the window and display height of the leads can be modified by opening the respective pulldown options.
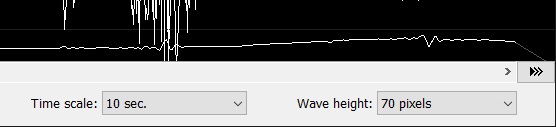
Time scale set to 10 seconds, wave height to 70 pixels
Display the values of the signals by clicking on any signal. The values of all signals underneath the mouse pointer are displayed, including their units (f.e. mV, mmHg, etc). The time of the displayed values is displayed at the top of the signal area and a small vertical line is drawn over each signal to indicate the position of the values displayed.
Checking 'Hot tracking' in the toolbar to constantly display the signal values, so no need to hold down the mouse button. Drag the mouse to display values at different time-positions. See image below.
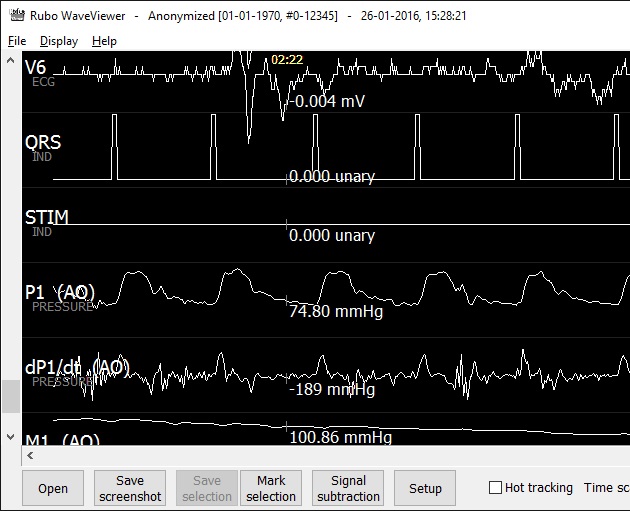
Values of the signals at time 02:22
The display height of the leads can be modified using the pulldown menu (Wave height) as described above. The leads are displayed within this height but the minimum and maximum values, the range of a lead, may exceed these height boundaries. Modify the range of a specific lead by moving the mouse pointer over the displayed lead and press the '-' key or '+' key on the keyboard until the range is correct. Press the Escape button to reset the range of all channels.
The range of a lead can be copied from one lead to the other. Click on the lead which range is to be copied. The range is now stored and can be copied to another lead by pressing and holding down the 'C' on the keyboard. Click on the lead to which the range should be copied, while holding the 'C'-key down. The range is now copied from one lead to the other. Reset the default range values by pressing the escape button.
See the images below.
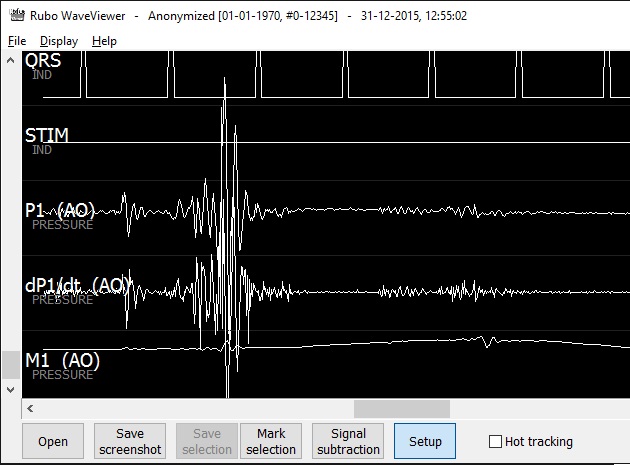
The P1 and dP1/dt leads exceeding the wave height boundary
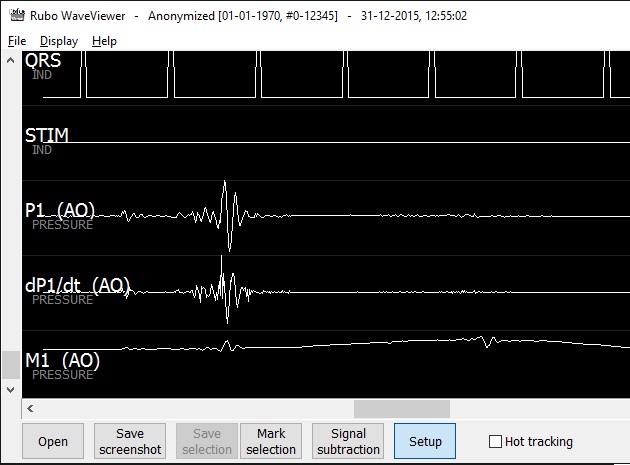
The range of the P1 and dP1/dt leads are set by the user
The DICOM Waveform Viewer opens any DICOM waveform file and displays the contents, the waveform sample data. The waveform viewer is part of the Rubo DICOM Viewer and can only be used in combination with the DICOM viewer. The DICOM viewer creates an overview of all DICOM material found on any storage medium (PACS, network- or local drives, USB storage, etc) and by double clicking on a waveform icon, the waveform viewer is opened.
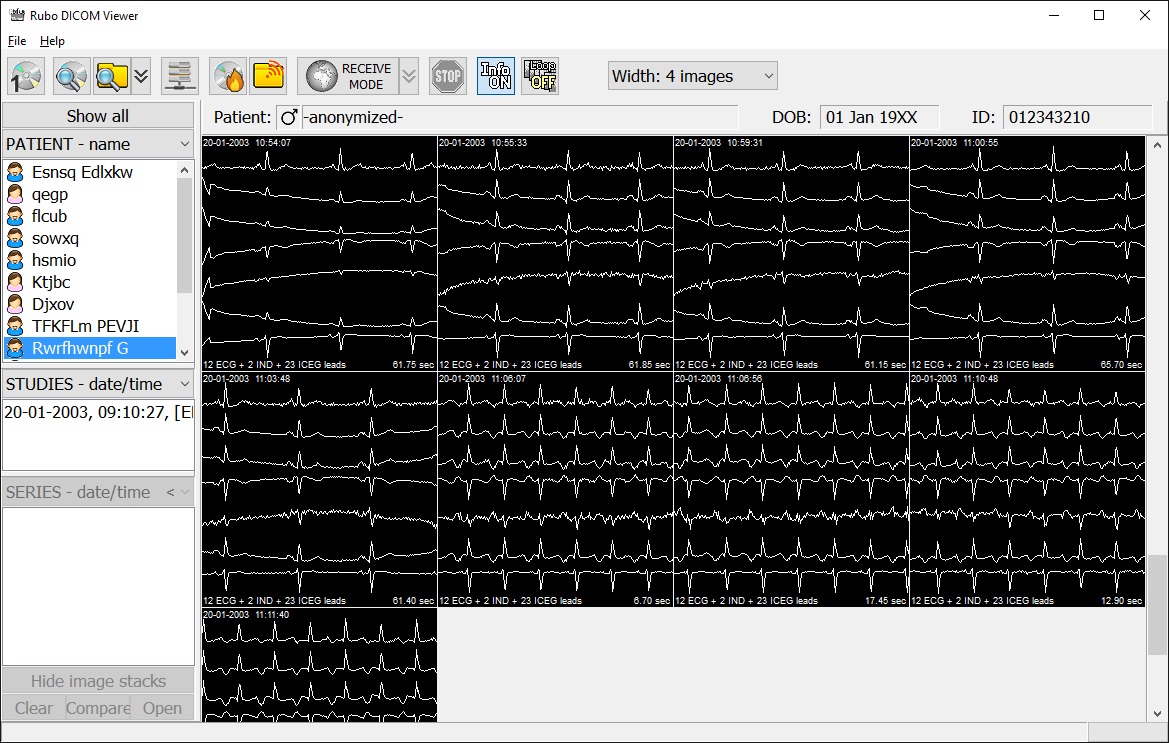
DICOM viewer showing an overview of waveforms of a specific patient
The icons as shown in the DICOM viewer (image above), show the first 4 seconds of the waveform samples, the date and time, the number of channels (leads), the type of leads, and the length. Double click a waveform-icon to open the waveform viewer (image below).
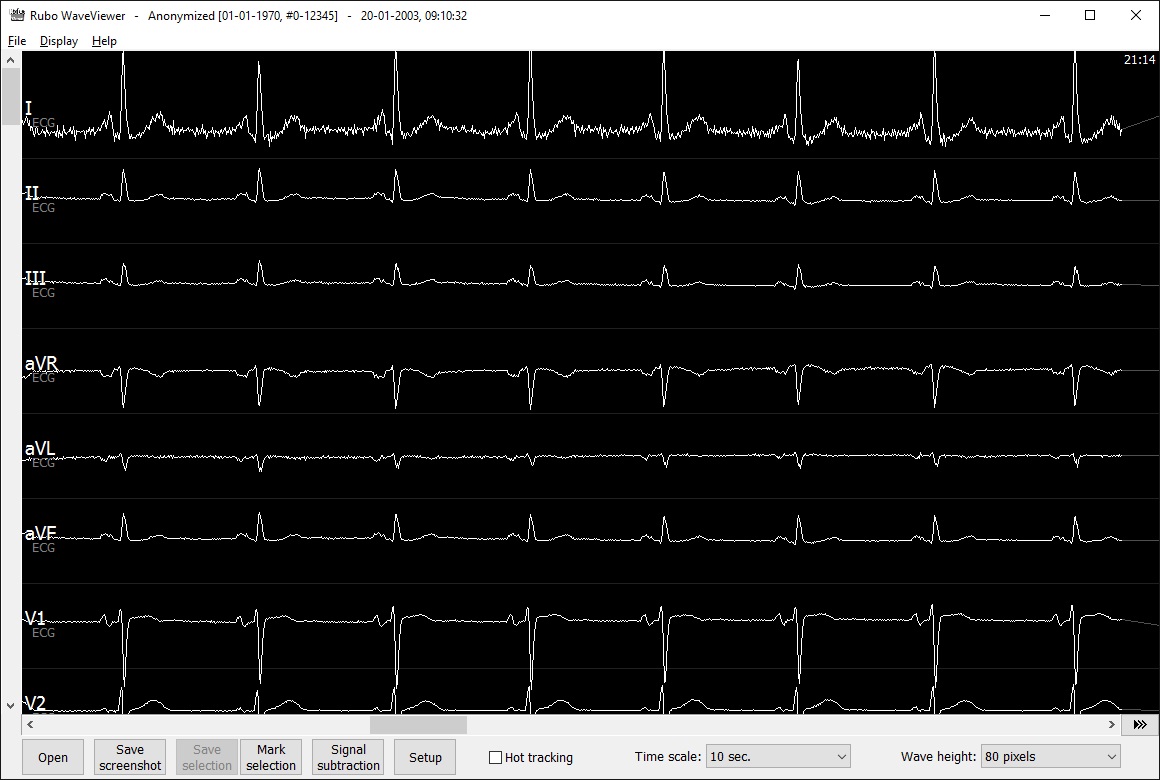
Waveform display. Use the scrollbars to display different leads at different times. Press the play button to display realtime.